Seeing Builds Confidence. Data Alone Does Not.
Most GI platforms describe what might be happening. ProteusDx™ allows you to see how your gut lining appears, providing visual context alongside microbiome and biomarker patterns.
Traditional Approach
- Isolated data points without visual confirmation
- Guessing what patterns mean structurally
- Waiting for symptoms to worsen before imaging
- No way to track mucosal changes over time
ProteusDx™ VCE Approach
- Direct visualization of small bowel lining
- Visual context for microbiome patterns
- Proactive monitoring before symptoms escalate
- Longitudinal mucosal trend tracking
The Critical Question VCE Answers
"How do these microbiome patterns relate to what's actually happening inside my gut?"
Visualization transforms abstract data into concrete understanding. When you can see the gut lining alongside microbial patterns, you gain clarity that data alone cannot provide. That clarity is what transforms testing into monitoring.
The Capsule's 8-10 Hour Journey
Watch the capsule travel through your entire digestive system, capturing thousands of high-resolution images along the way.
Esophagus
Upper GI Tract
The capsule travels through the esophagus into the stomach. This phase is very brief.
Stomach
Upper GI Tract
The capsule enters the stomach where it captures images of the gastric lining and mucosa.
Duodenum
Small Bowel - Proximal
First section of the small intestine where most digestion occurs. Critical area for monitoring.
Jejunum
Small Bowel - Mid
Middle section of the small intestine where most nutrient absorption takes place.
Ileum
Small Bowel - Distal
Final section of the small intestine before entering the colon. Key area for immune function.
Colon Entry
Large Intestine
The capsule enters the colon and continues capturing images until naturally expelled.
How Video Capsule Endoscopy Works
A non-invasive, patient-friendly way to visualize the small bowel
Swallow the Capsule
A small, pill-sized camera capsule is swallowed with water. No sedation, no invasive procedures.
Natural Transit
The capsule travels through your digestive tract naturally, capturing thousands of images along the way.
Image Capture
High-resolution cameras capture detailed images of your small bowel lining over 8-10 hours.
AI Analysis
Images are analyzed using AI-enhanced tools to identify areas of interest and create your visualization timeline.
FDA-Cleared
VCE technology is FDA-cleared for visualization and monitoring purposes, ensuring safety and regulatory compliance.
Non-Invasive
No sedation, no discomfort, no downtime. Continue your normal activities during the 8-10 hour capture period.
Comprehensive Coverage
Visualizes the entire small bowel, an area difficult to reach with traditional endoscopy methods.
What You'll See During VCE
These are examples of actual capsule endoscopy images showing different sections of the small bowel. Understanding what normal and monitored areas look like builds confidence in the technology.
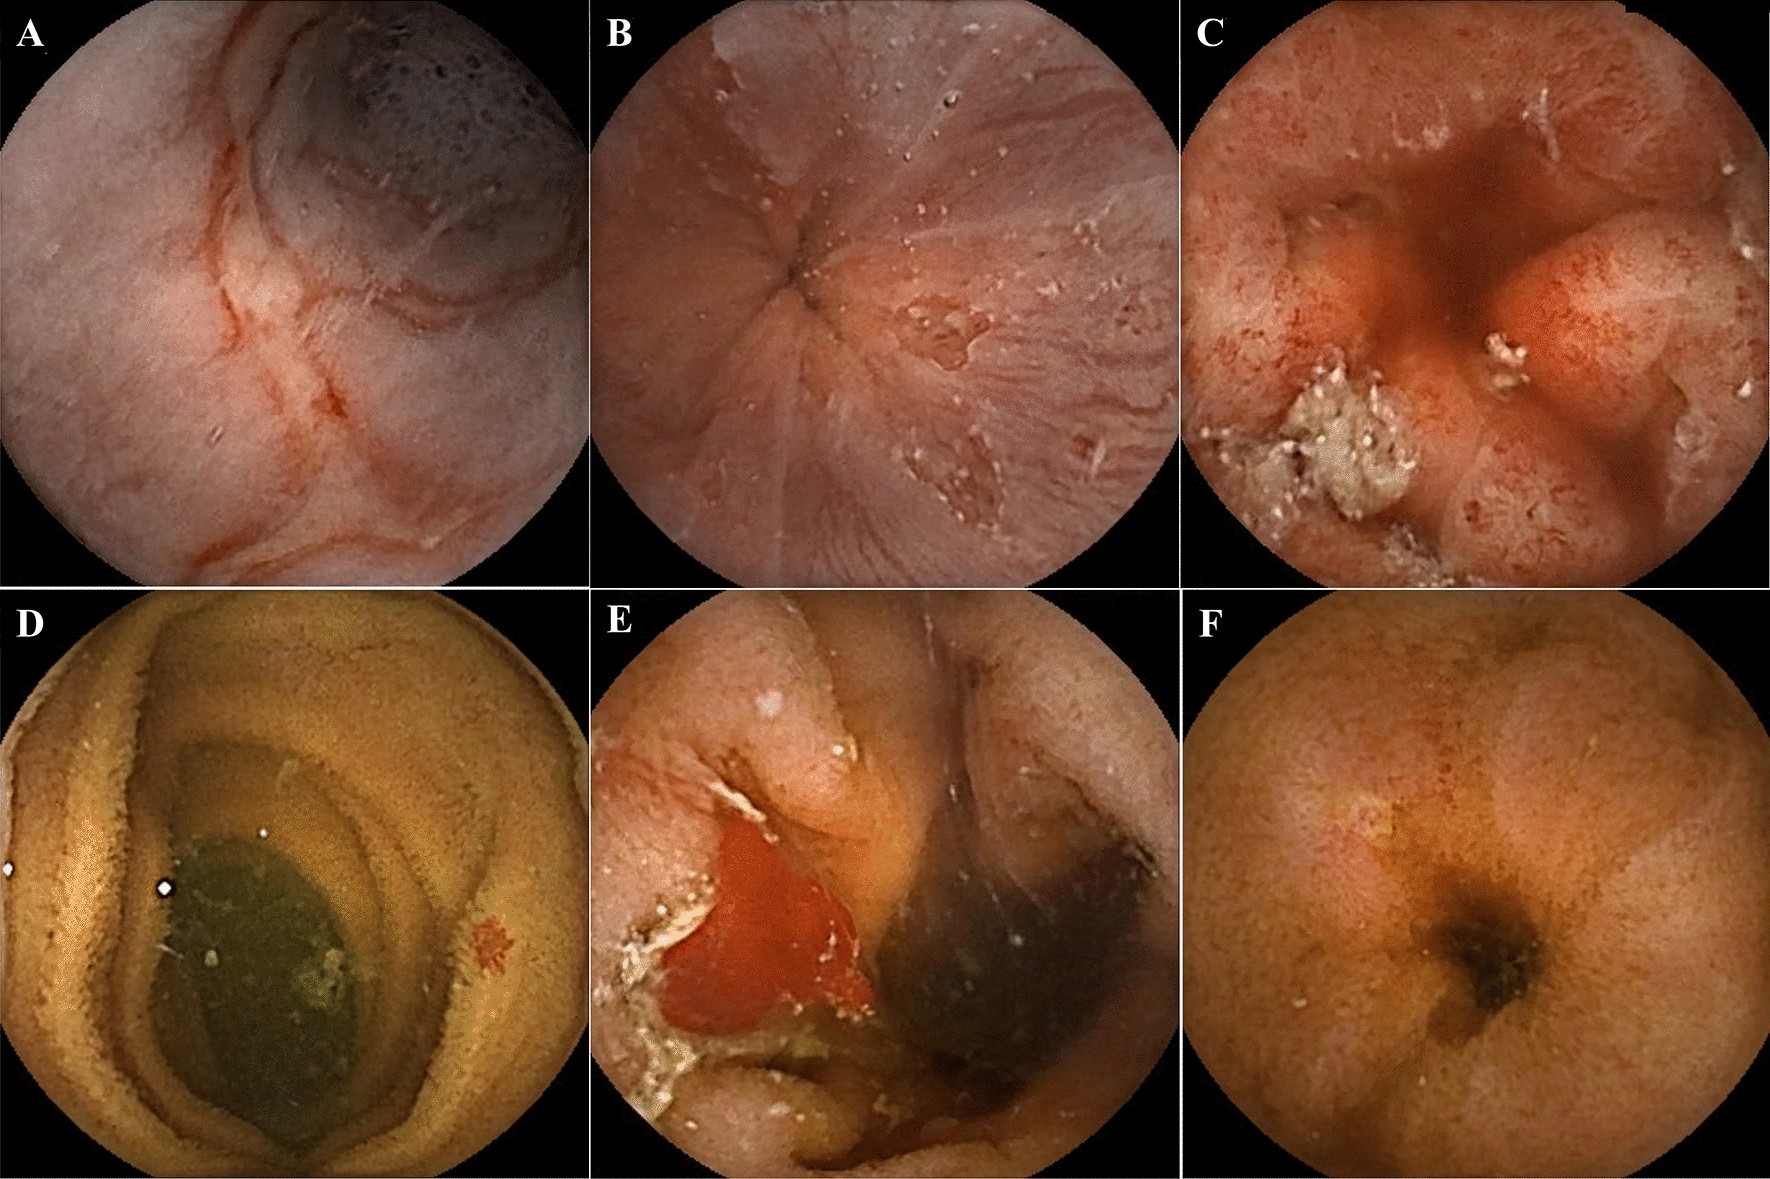
Normal Findings
Healthy small bowel lining with intact villi structure, uniform color, and smooth mucosal surface. These baseline images help establish your individual reference point.

AI-Enhanced Analysis
Advanced algorithms identify areas of interest across thousands of images, creating a comprehensive map of your small bowel for clinician review and monitoring.

Monitoring Context
Longitudinal tracking allows comparison over time, showing stability or changes in mucosal appearance alongside your microbiome and biomarker patterns.
Building Confidence Through Visualization
When you can see the actual appearance of your small bowel lining, you move from wondering to knowing. This visual context transforms abstract data into concrete understanding, helping you and your clinician make more informed monitoring decisions.
See the texture and color of your gut lining
Track changes in mucosal appearance over time
Correlate visual findings with microbiome patterns
Gain clarity that data alone cannot provide
Sample images courtesy of published medical research. Actual VCE results vary by individual.
The Correlation Lens
ProteusDx™'s core innovation: showing alignment between microbiome patterns and visual context, without claiming causation.
| Microbiome Pattern | Visual Context |
|---|---|
| Low Diversity | Areas with less uniform villi appearance |
| Reduced SCFA Signals | Regions showing reduced mucosal sheen |
| Pathobiont Shift | Localized areas flagged for monitoring |
| Higher Inflammatory Pattern | Regions selected for closer visual follow-up |
"Some microbiome patterns are commonly explored alongside visualization to better understand how the gut lining appears over time."
Critical Design Principle: We show alignment, not causation. No arrows, no "leads to," no "causes." This approach maintains regulatory compliance while providing valuable monitoring context.
Longitudinal Mucosal Tracking
VCE transforms ProteusDx™ into a monitoring platform, not a one-time test
Track Changes Over Time
Platinum tier members gain access to longitudinal timeline tracking that overlays microbiome test dates, VCE visualization dates, and AI pattern stability indicators. This creates a comprehensive view of your GI health trajectory.
Improving
Patterns showing positive trajectory
Stable
Consistent patterns over time
Shifting
Changes warranting closer attention
Important Medical Disclaimer
Video Capsule Endoscopy visualization is for educational and monitoring purposes only and does not confirm or rule out medical conditions. VCE uses FDA-cleared technology and is interpreted within a clinician-guided framework. ProteusDx™ does not diagnose disease or replace medical care. Our platform is designed to support informed monitoring, education, and appropriate escalation when needed.